
 Available in US
Content

Correct Score Markets Carry the Highest Margins in Football Betting
The first correct score bet I ever placed was 2-1 to the home side at 7.00. It came in. I felt like a prophet. The second was 1-0 at 6.50. Lost. The third was 3-2 at 17.00. Lost. By the time I sat down and did the maths, I realised that my one winner had not covered my losses — and that the margins embedded in correct score pricing were the reason. The bookmaker was taking a bigger cut from every correct score bet than from any other football market.
Football generates approximately 1.3 billion pounds in remote gross gambling yield in the UK, and correct score markets contribute a disproportionate share relative to their betting volume. The total remote betting market sits at around 2.6 billion pounds in GGY. Correct score is where operators make their fattest margins — overrounds of 30-50% are common, compared with 5-8% on a standard 1X2 market. Understanding why those margins exist, and where they occasionally crack, is the difference between treating correct score as a lottery and treating it as an analytical exercise.
How Bookmakers Set Correct Score Odds
A correct score market typically offers 20 to 30 possible outcomes — every scoreline from 0-0 to 4-3, plus a catch-all “any other” result. Each outcome has its own probability, and the bookmaker calculates these using statistical models, primarily Poisson-based distributions, before applying a margin to each price.
The Poisson model starts with the expected goals for each team. If the home side is expected to score 1.6 goals and the away side 1.1, the model generates a probability for every possible goal total for each team, then combines them into a matrix of scoreline probabilities. A 1-0 result might have a raw probability of 11%, which translates to fair odds of about 9.00. The bookmaker then shaves that to 7.00 or 6.50, pocketing the difference.
The reason margins are so wide is that the market has many outcomes, each with a small probability. When you have 25 possible results instead of three, the operator can embed margin across all of them without any single price looking obviously unfair. A bettor can glance at 7.00 for a 1-0 scoreline and think it looks reasonable, without realising that the fair price should be 9.00. The margin is hidden in plain sight across the entire probability distribution.

The Poisson Model: A Starting Point for Scoreline Prediction
If you want to bet correct scores with any discipline, you need your own pricing model. The Poisson distribution is the standard starting point. It requires just two inputs: the expected goals for each team. You can source these from xG data on freely available platforms.
The calculation works as follows. For a team with expected goals of 1.5, the probability of scoring exactly 0 goals is e^(-1.5) * 1.5^0 / 0! = 0.223, or about 22.3%. The probability of scoring exactly 1 is e^(-1.5) * 1.5^1 / 1! = 0.335, or 33.5%. The probability of scoring exactly 2 is e^(-1.5) * 1.5^2 / 2! = 0.251, or 25.1%. You calculate the same for the opposing team, then multiply the two probabilities for each scoreline combination. Home 1, Away 0 = P(Home scores 1) * P(Away scores 0).
The limitation is that basic Poisson assumes independence between the two teams’ scoring. In reality, goals are not fully independent — a team going behind changes their tactical approach, which affects the probability of subsequent goals. More sophisticated models adjust for this correlation, but even a basic Poisson gives you a useful benchmark. If the bookmaker prices 1-1 at 6.00 and your Poisson model says the fair price is 6.80, you know the bet has negative expected value. If the model says the fair price is 5.20, you have a potential edge.

I run a Poisson model for every Premier League fixture and compare its output against bookmaker prices. In a typical matchweek, I find one or two scorelines where the bookmaker’s price exceeds my model’s fair odds by more than 15%. Those are the only correct score bets I place. Everything else gets ignored.

When Correct Score Bets Might Offer Value
Despite the punishing margins, there are scenarios where correct score betting becomes analytically defensible.
The first is low-scoring fixtures between defensively solid teams. In a match where both sides average under 1.0 xG conceded, the probability distribution compresses around a narrow range of scorelines: 0-0, 1-0, 0-1, 1-1. With fewer plausible outcomes, your model’s precision improves and the bookmaker’s margin has fewer places to hide. I find the best value in 0-0 and 1-0 lines in these fixtures — the two most common results that casual bettors instinctively avoid because they are boring.

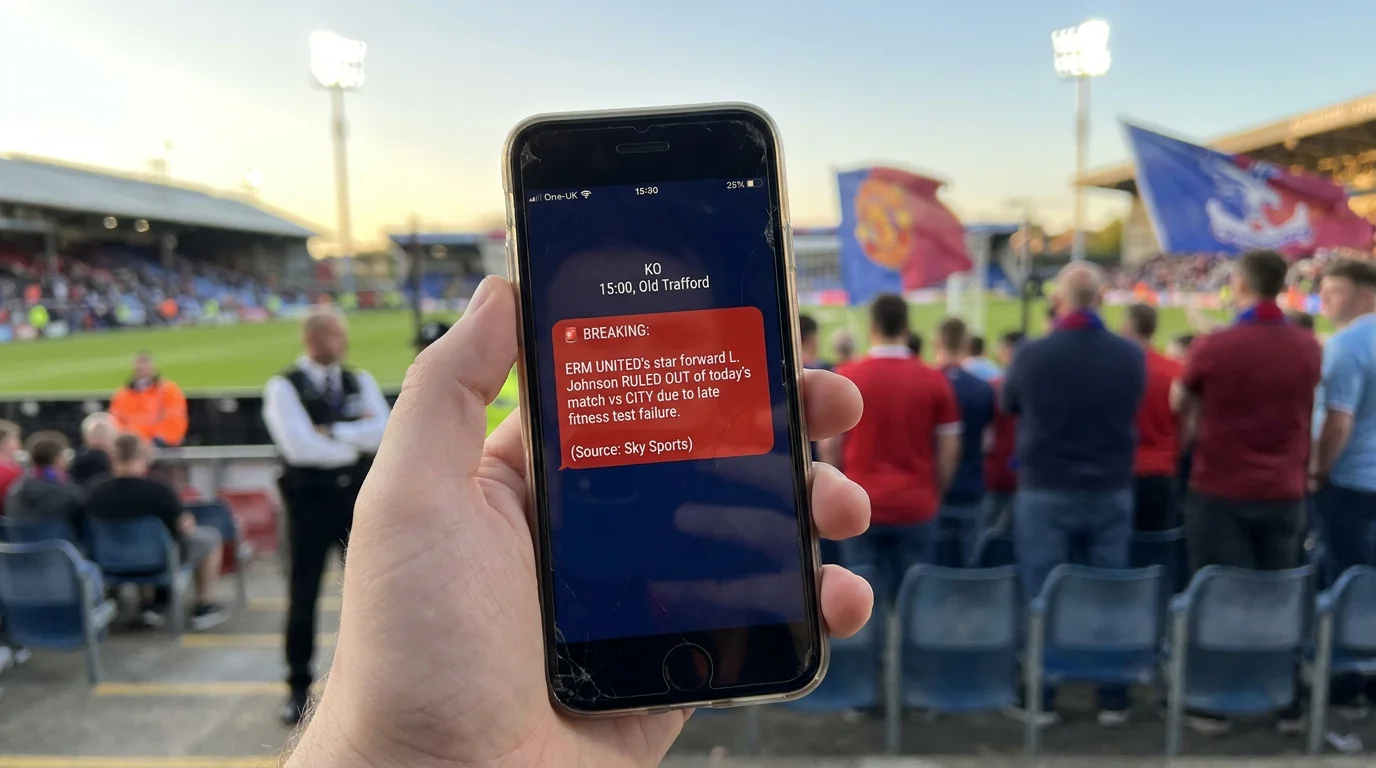
The second is matches where team news significantly shifts the expected goals after the odds have been set. If a team’s primary striker is ruled out two hours before kick-off, their xG drops but the correct score market often adjusts more slowly than the 1X2 or goals markets. The window is short — sometimes 30 to 60 minutes — but it exists, particularly in lower-profile fixtures where the operator’s trading desk is less attentive.
The third is using correct score as a complement to other markets rather than a standalone bet. If your analysis points to a low-scoring home win, you might place a primary bet on under 2.5 goals and a smaller correct score bet on 1-0 at longer odds. The correct score bet acts as a leveraged extension of the same thesis. If the thesis is right and the scoreline lands, the return is outsized. If the thesis is right but the exact score is wrong, the under 2.5 bet still covers you. For a deeper understanding of how these odds are constructed and what the numbers mean, the odds explained guide walks through the conversion from probability to price.
What is the Poisson distribution in football score prediction?
The Poisson distribution is a statistical model that calculates the probability of a given number of events occurring in a fixed interval, given a known average rate. In football, it takes the expected goals for each team and generates a probability for every possible scoreline. It is the standard baseline model for correct score pricing, though it has limitations — particularly its assumption that each team’s goals are independent of the other’s.
Is correct score betting profitable long-term?
For most bettors, no. The margins on correct score markets are the highest in football betting, typically 30-50% overround compared with 5-8% on match result. Profitable correct score betting requires a pricing model that consistently identifies mispriced scorelines, disciplined selection, and a willingness to accept long losing streaks between winners. It is one of the hardest markets to beat sustainably.
