
 Available in US
Content
Draws Happen in Around 25% of Football Matches — but Most Bettors Ignore Them
I once spent an entire Premier League season tracking every time I considered backing the draw and talked myself out of it. By May, I had a spreadsheet of 47 fixtures where the draw had been my initial instinct. Twenty-three of them — just under half — ended level. Had I backed every one at average odds of 3.40, I would have returned a healthy profit. Instead, I backed the home win or the away win because those felt like “real” bets, and I finished the season marginally down on match result markets.
That experience changed the way I think about the draw. Football generates around 1.3 billion pounds in remote gross gambling yield in the UK each year, and the draw market is one of the most consistently mispriced segments within that figure. Around 5.8% of UK adults bet on football, yet the vast majority of that activity clusters around home and away wins. The draw sits in a psychological blind spot — and that blind spot is where the value lives.
Why Bookmakers and Bettors Undervalue the Draw
The draw is the only outcome in a 1X2 market that nobody wants to happen. Home fans want their team to win. Away fans want the upset. Neutral bettors want a story — a dominant performance, a late comeback, a clear winner. Nobody tunes in hoping for a goalless stalemate. This emotional asymmetry creates a structural pricing inefficiency.
Bookmakers set odds partly based on the weight of money. When the majority of bets flow towards home and away outcomes, the operator shortens those prices and allows the draw to drift. The drift is not necessarily because the draw has become less likely — it is because fewer people are betting on it. The Betting and Gaming Council’s Grainne Hurst has noted that betting is a genuinely enjoyable experience for 22 million people in the UK each month, and enjoyment biases people towards exciting outcomes. The draw is rarely exciting. It is, however, frequently profitable.
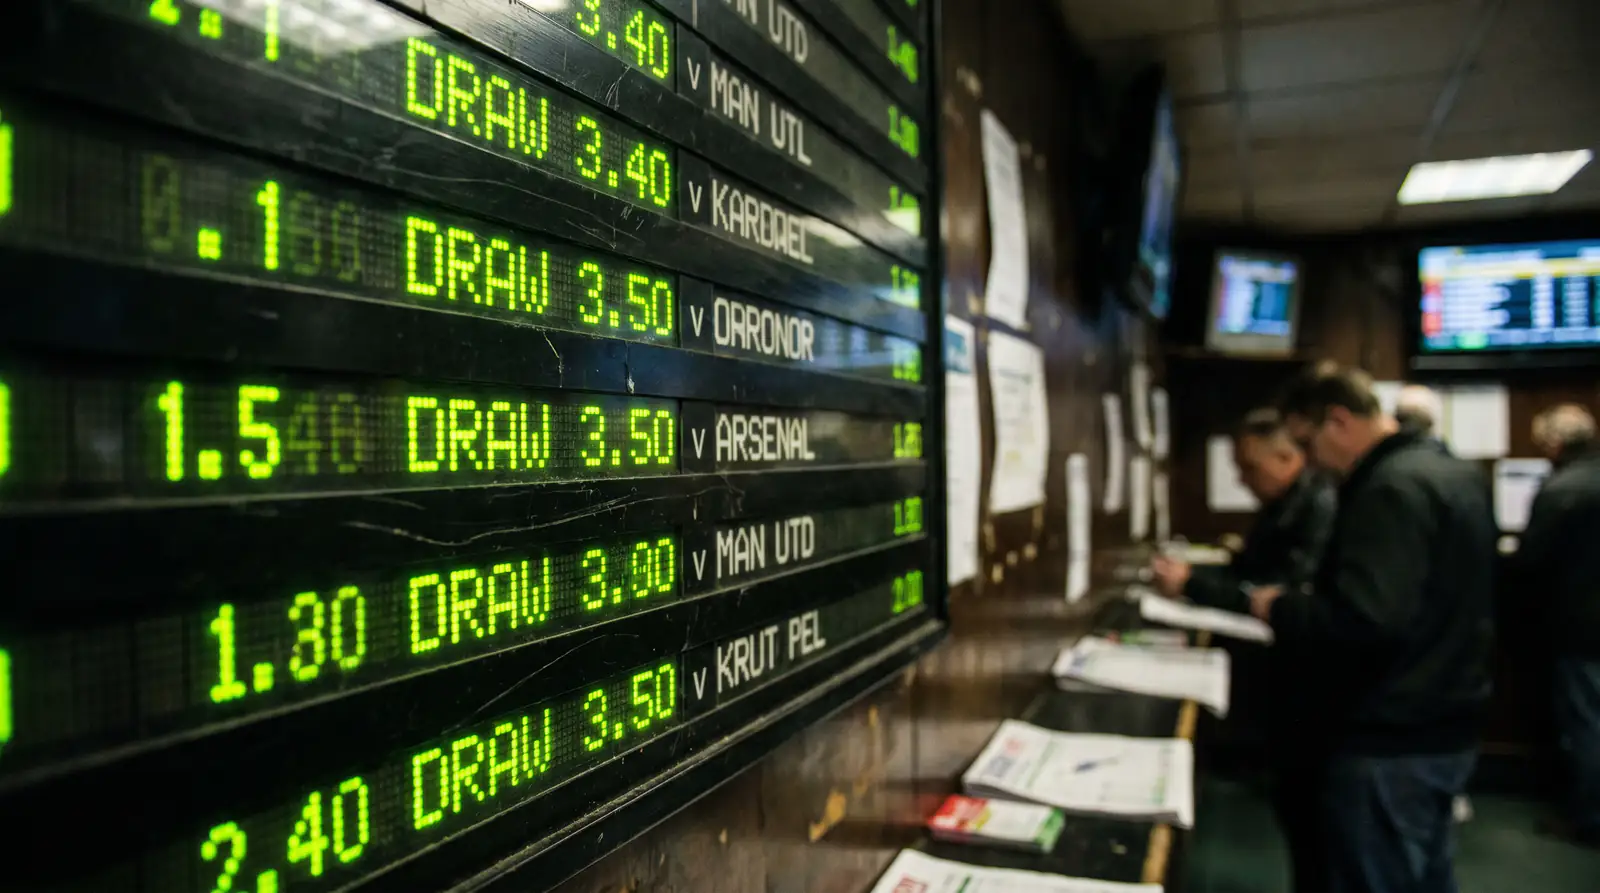
Academic research on European football consistently finds that the draw is underbet relative to its true probability across most leagues. The effect is strongest in matches between evenly matched sides — precisely the fixtures where a draw is most likely. The market prices the home win at, say, 2.50 and the away win at 3.00, and the draw sits at 3.40. Run the numbers and you often find the draw’s implied probability is lower than its historical frequency in comparable fixtures.
I have tracked draw frequencies across five seasons of Premier League football, and the pattern holds: draws occur in 23-27% of matches depending on the season, but the average implied probability from bookmaker odds prices them at 21-24%. That gap of two to three percentage points is the edge.
Draw No Bet: Removing the Draw Instead of Backing It
Before I discuss how to back the draw, it is worth understanding the opposite approach: Draw No Bet, which removes the draw from the equation entirely. DNB is a market where you back a team to win, and if the match finishes level, your stake is returned. You lose only if the team you backed loses.
DNB functions identically to an Asian handicap 0 line. If you back a team at DNB and they win, you collect your winnings. If the match draws, your stake is refunded. If they lose, you lose your stake. The odds are lower than a straight 1X2 win bet because the draw outcome is effectively insured.
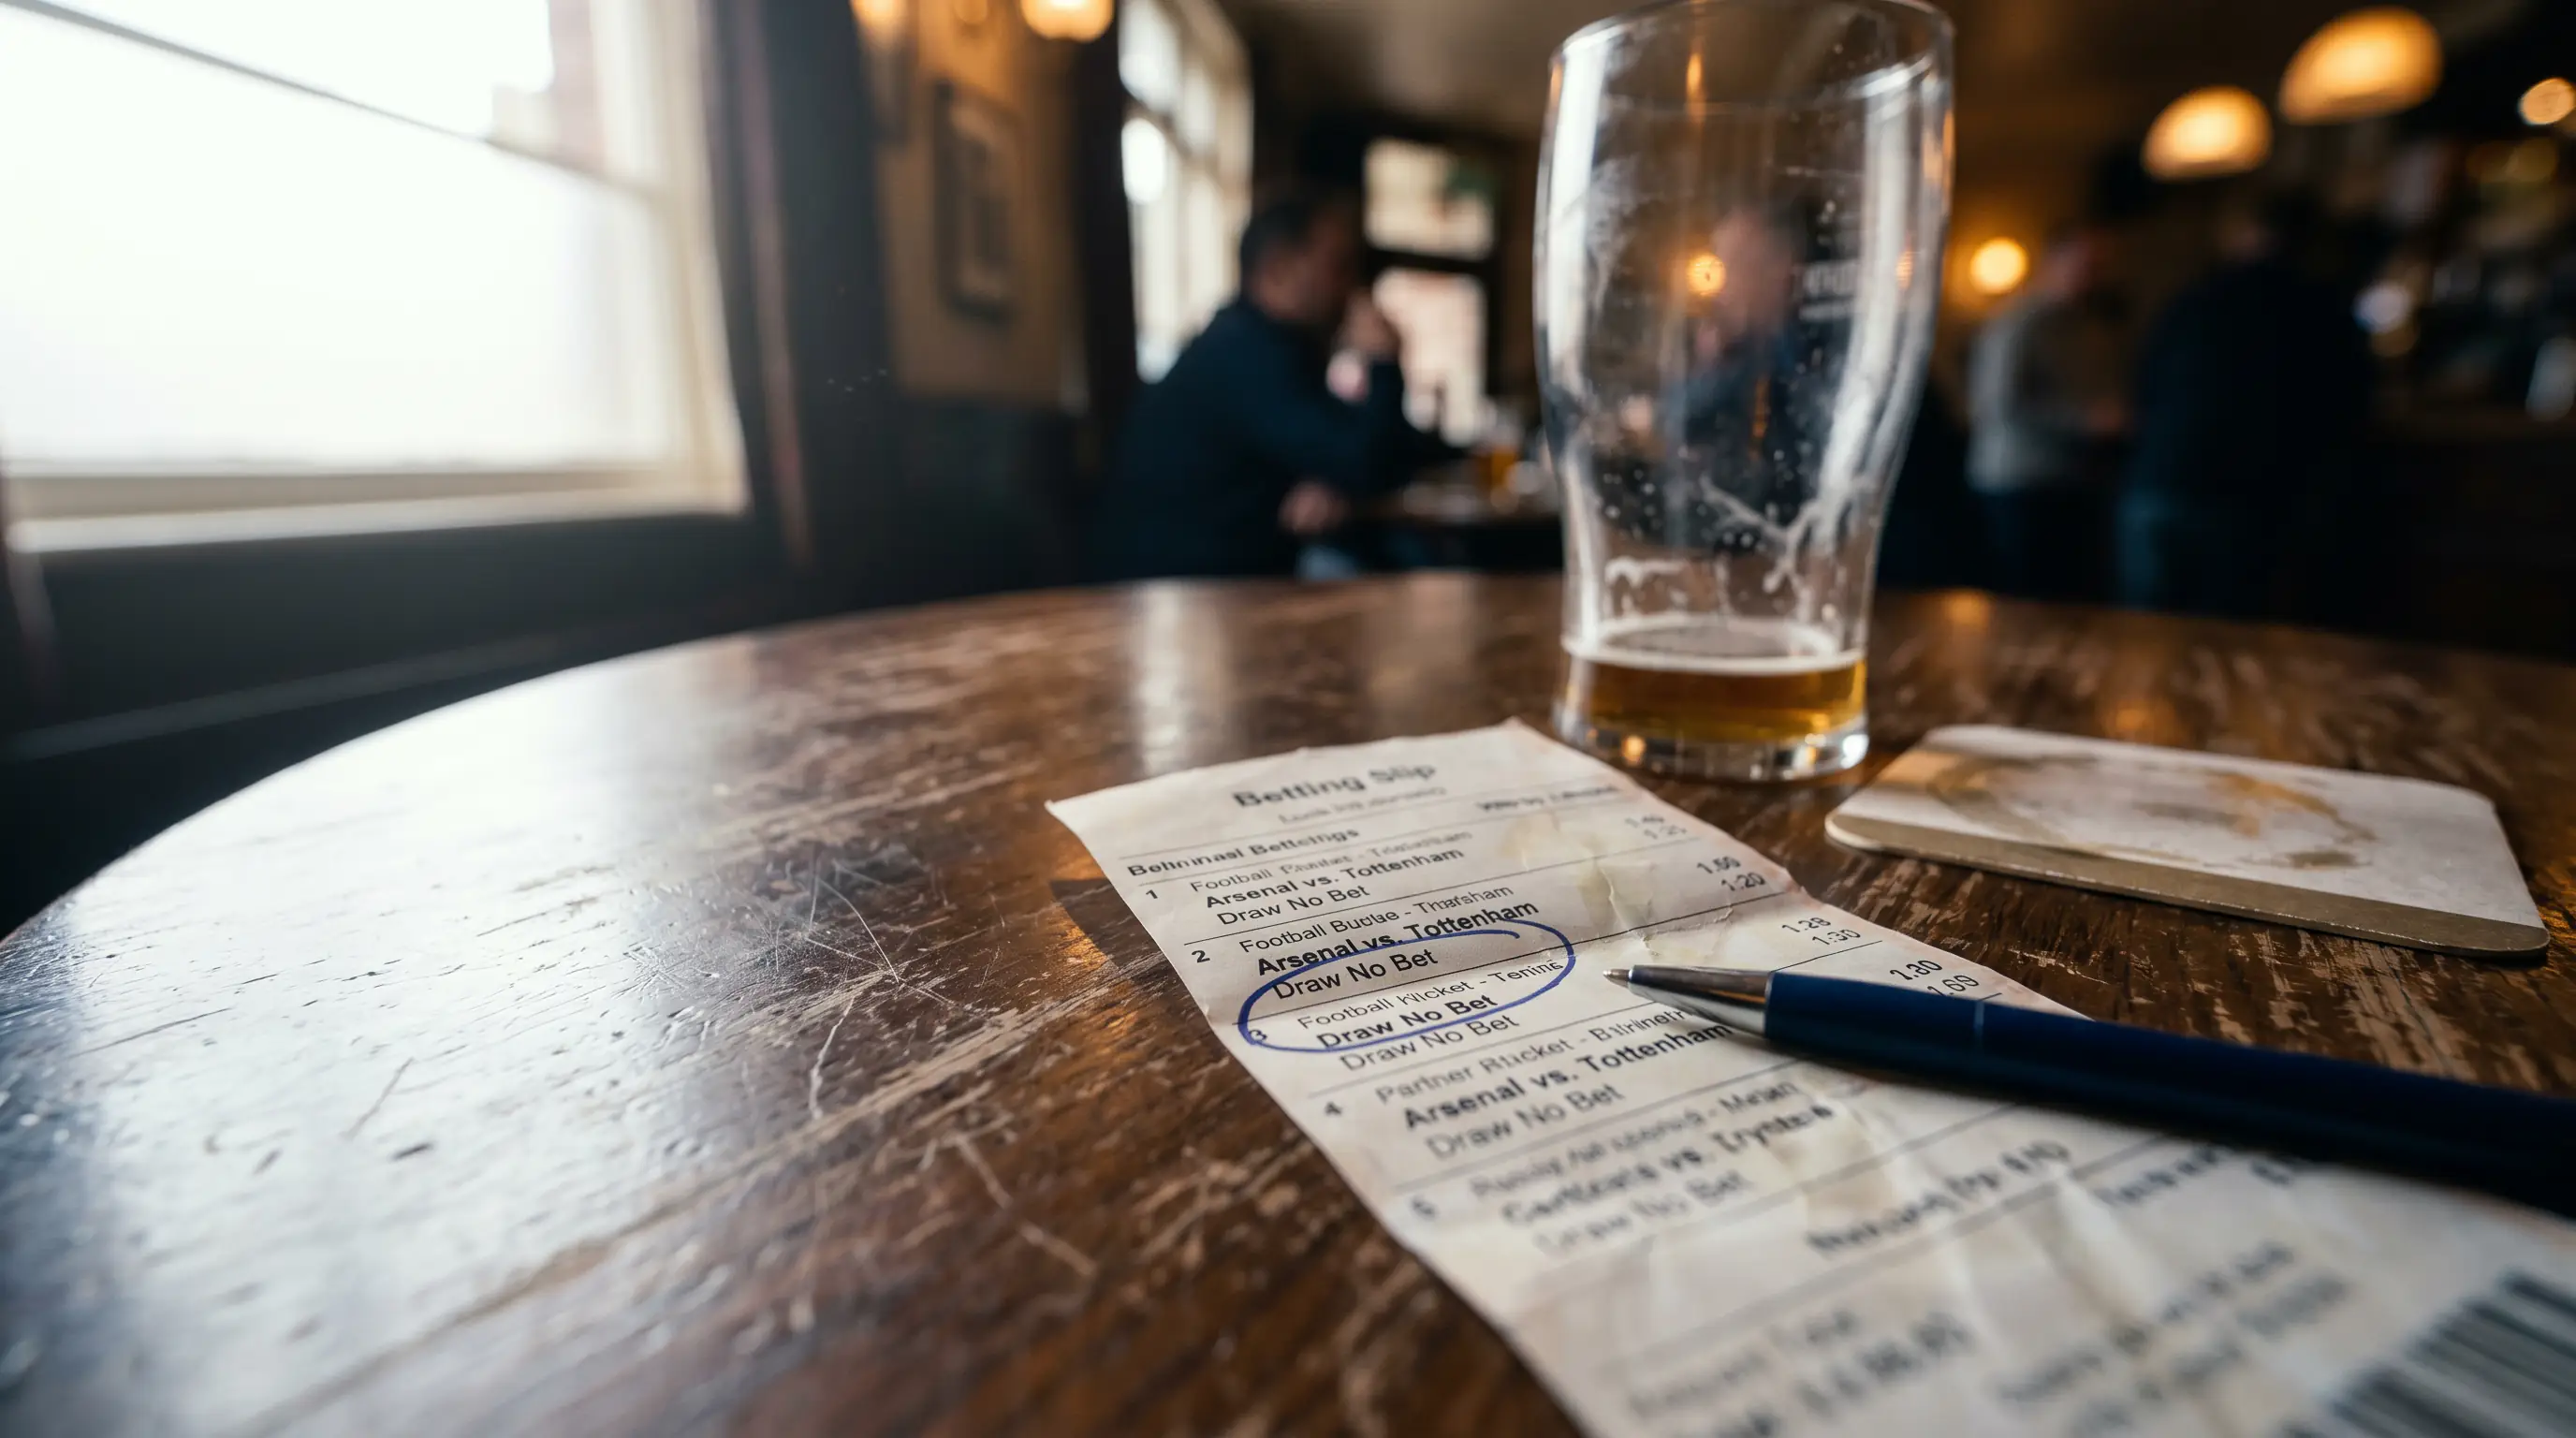
I use DNB as a defensive tool in fixtures where I fancy a team to win but the draw probability is uncomfortably high — say above 30%. Rather than accepting the draw risk on a straight win bet, I take the lower DNB odds and know that the most likely losing scenario for my bet is eliminated. Over a season, the reduced variance from DNB selections more than compensates for the lower individual returns.
The critical distinction is this: if you believe the draw is underpriced, back the draw. If you believe a team will win but want protection against the draw, use DNB. They are opposite strategies addressing the same market dynamic.
Spotting Draw-Prone Fixtures: Stats and Patterns
Not every match is a draw candidate. The fixtures where draws cluster share identifiable characteristics, and those characteristics can be measured before kick-off.
The first indicator is competitive balance. Matches between teams within five league positions of each other produce draws at a significantly higher rate than matches with a wide gap. When I analyse a fixture, I look at the difference in expected points per game over the previous ten matches. If the gap is less than 0.3, the draw probability rises sharply.

The second indicator is defensive solidity on both sides. Teams that concede fewer than 1.0 expected goals per match at home or away produce more draws than leaky defences. A fixture between two sides averaging 0.8 xGA is a draw candidate. A fixture between two sides averaging 1.5 xGA is more likely to produce a decisive result in either direction.
The third indicator is tactical context. Derbies, matches between mid-table sides with nothing to play for in the final weeks, and fixtures where one team needs a point to secure a target — promotion, survival, qualification — all produce draws at elevated rates. The tactical incentive to avoid losing outweighs the incentive to win, and the result is a cagey, conservative match that drifts towards a stalemate.

The fourth indicator is historical head-to-head. Some fixture pairings produce draws with remarkable consistency across seasons. I maintain a database of head-to-head results going back ten years, and certain matchups — particularly in the Championship and lower leagues — draw at rates above 35%. The bookmaker’s model accounts for this to some extent, but my experience is that it underweights head-to-head history relative to current-season form. For a complementary approach to the goals dimension of these same fixtures, the over/under goals betting guide covers how to assess whether a draw-prone fixture will be goalless or end 1-1.

What percentage of Premier League matches end in a draw?
Over the past five seasons, draws have accounted for between 23% and 27% of Premier League results, with the average sitting around 25%. The draw rate fluctuates season to season based on competitive balance across the division, but it has remained remarkably consistent over the long term. This is higher than the implied probability most bookmakers price into their draw odds.
Is draw no bet the same as the Asian handicap 0?
Yes, functionally they are identical. Both return your stake if the match finishes level, pay out if your selected team wins, and lose if your selected team loses. The odds should be the same or very close across both markets. Some operators display them as separate markets, but the underlying mechanics and pricing are equivalent.
