
 Available in US
Content

Better Data Is the Only Sustainable Edge in Football Betting
In my first year of betting on football, my “analysis” consisted of reading match previews and trusting my gut. I won roughly half the time, which felt decent until I calculated that the bookmaker’s margin meant I was losing steadily. The shift happened when I started using data — actual numbers rather than narratives. My strike rate did not change dramatically, but my ability to identify mispriced odds improved measurably. The bets I placed became fewer and more selective, and the results followed.
Football generates approximately 1.3 billion pounds in remote gross gambling yield annually in the UK, and the bookmakers who capture that revenue use sophisticated data models to set their odds. With over 290 million online bets placed monthly in the UK, the market is priced by algorithms that ingest far more information than any human can process manually. You do not need to match their resources — you need to find the corners of the market where their models are weakest, and that starts with having the right data.
Expected Goals and What It Tells You
Expected goals — xG — is the single most important metric for football betting. It measures the quality of chances created by each team by assigning a probability to every shot based on its location, angle, body part used, and the pattern of play that preceded it. A penalty has an xG of roughly 0.76. A shot from the edge of the box after a fast counter-attack might be 0.08. The sum of all shot xGs in a match gives you the expected goals for each team.
xG separates process from outcome. A team that wins 1-0 from a lucky deflection while creating 0.4 xG is performing poorly. A team that loses 0-1 despite generating 2.3 xG is performing well — they were wasteful or unlucky, and regression towards their underlying performance is likely. The bookmaker’s model incorporates xG, but it also incorporates results. When results diverge from xG, the market’s adjustment often lags by one to two matchweeks. That lag is exploitable.
I track rolling six-match xG averages rather than season-long figures. Season-long xG smooths out too much variation — a team’s form in September tells you little about their likely output in March. The six-match rolling average captures recent tactical changes, personnel shifts, and form trends without being overly reactive to single-match noise.

Beyond raw xG, I monitor xG difference (xG for minus xG against) as a measure of overall dominance, and non-penalty xG for a cleaner picture of open-play chance creation. Penalties inflate xG and can distort a team’s underlying creative output. A team generating 1.8 xG per match looks impressive until you discover that 0.6 of that comes from penalties. Strip those out and they are a 1.2 xG side — a very different proposition for betting purposes.
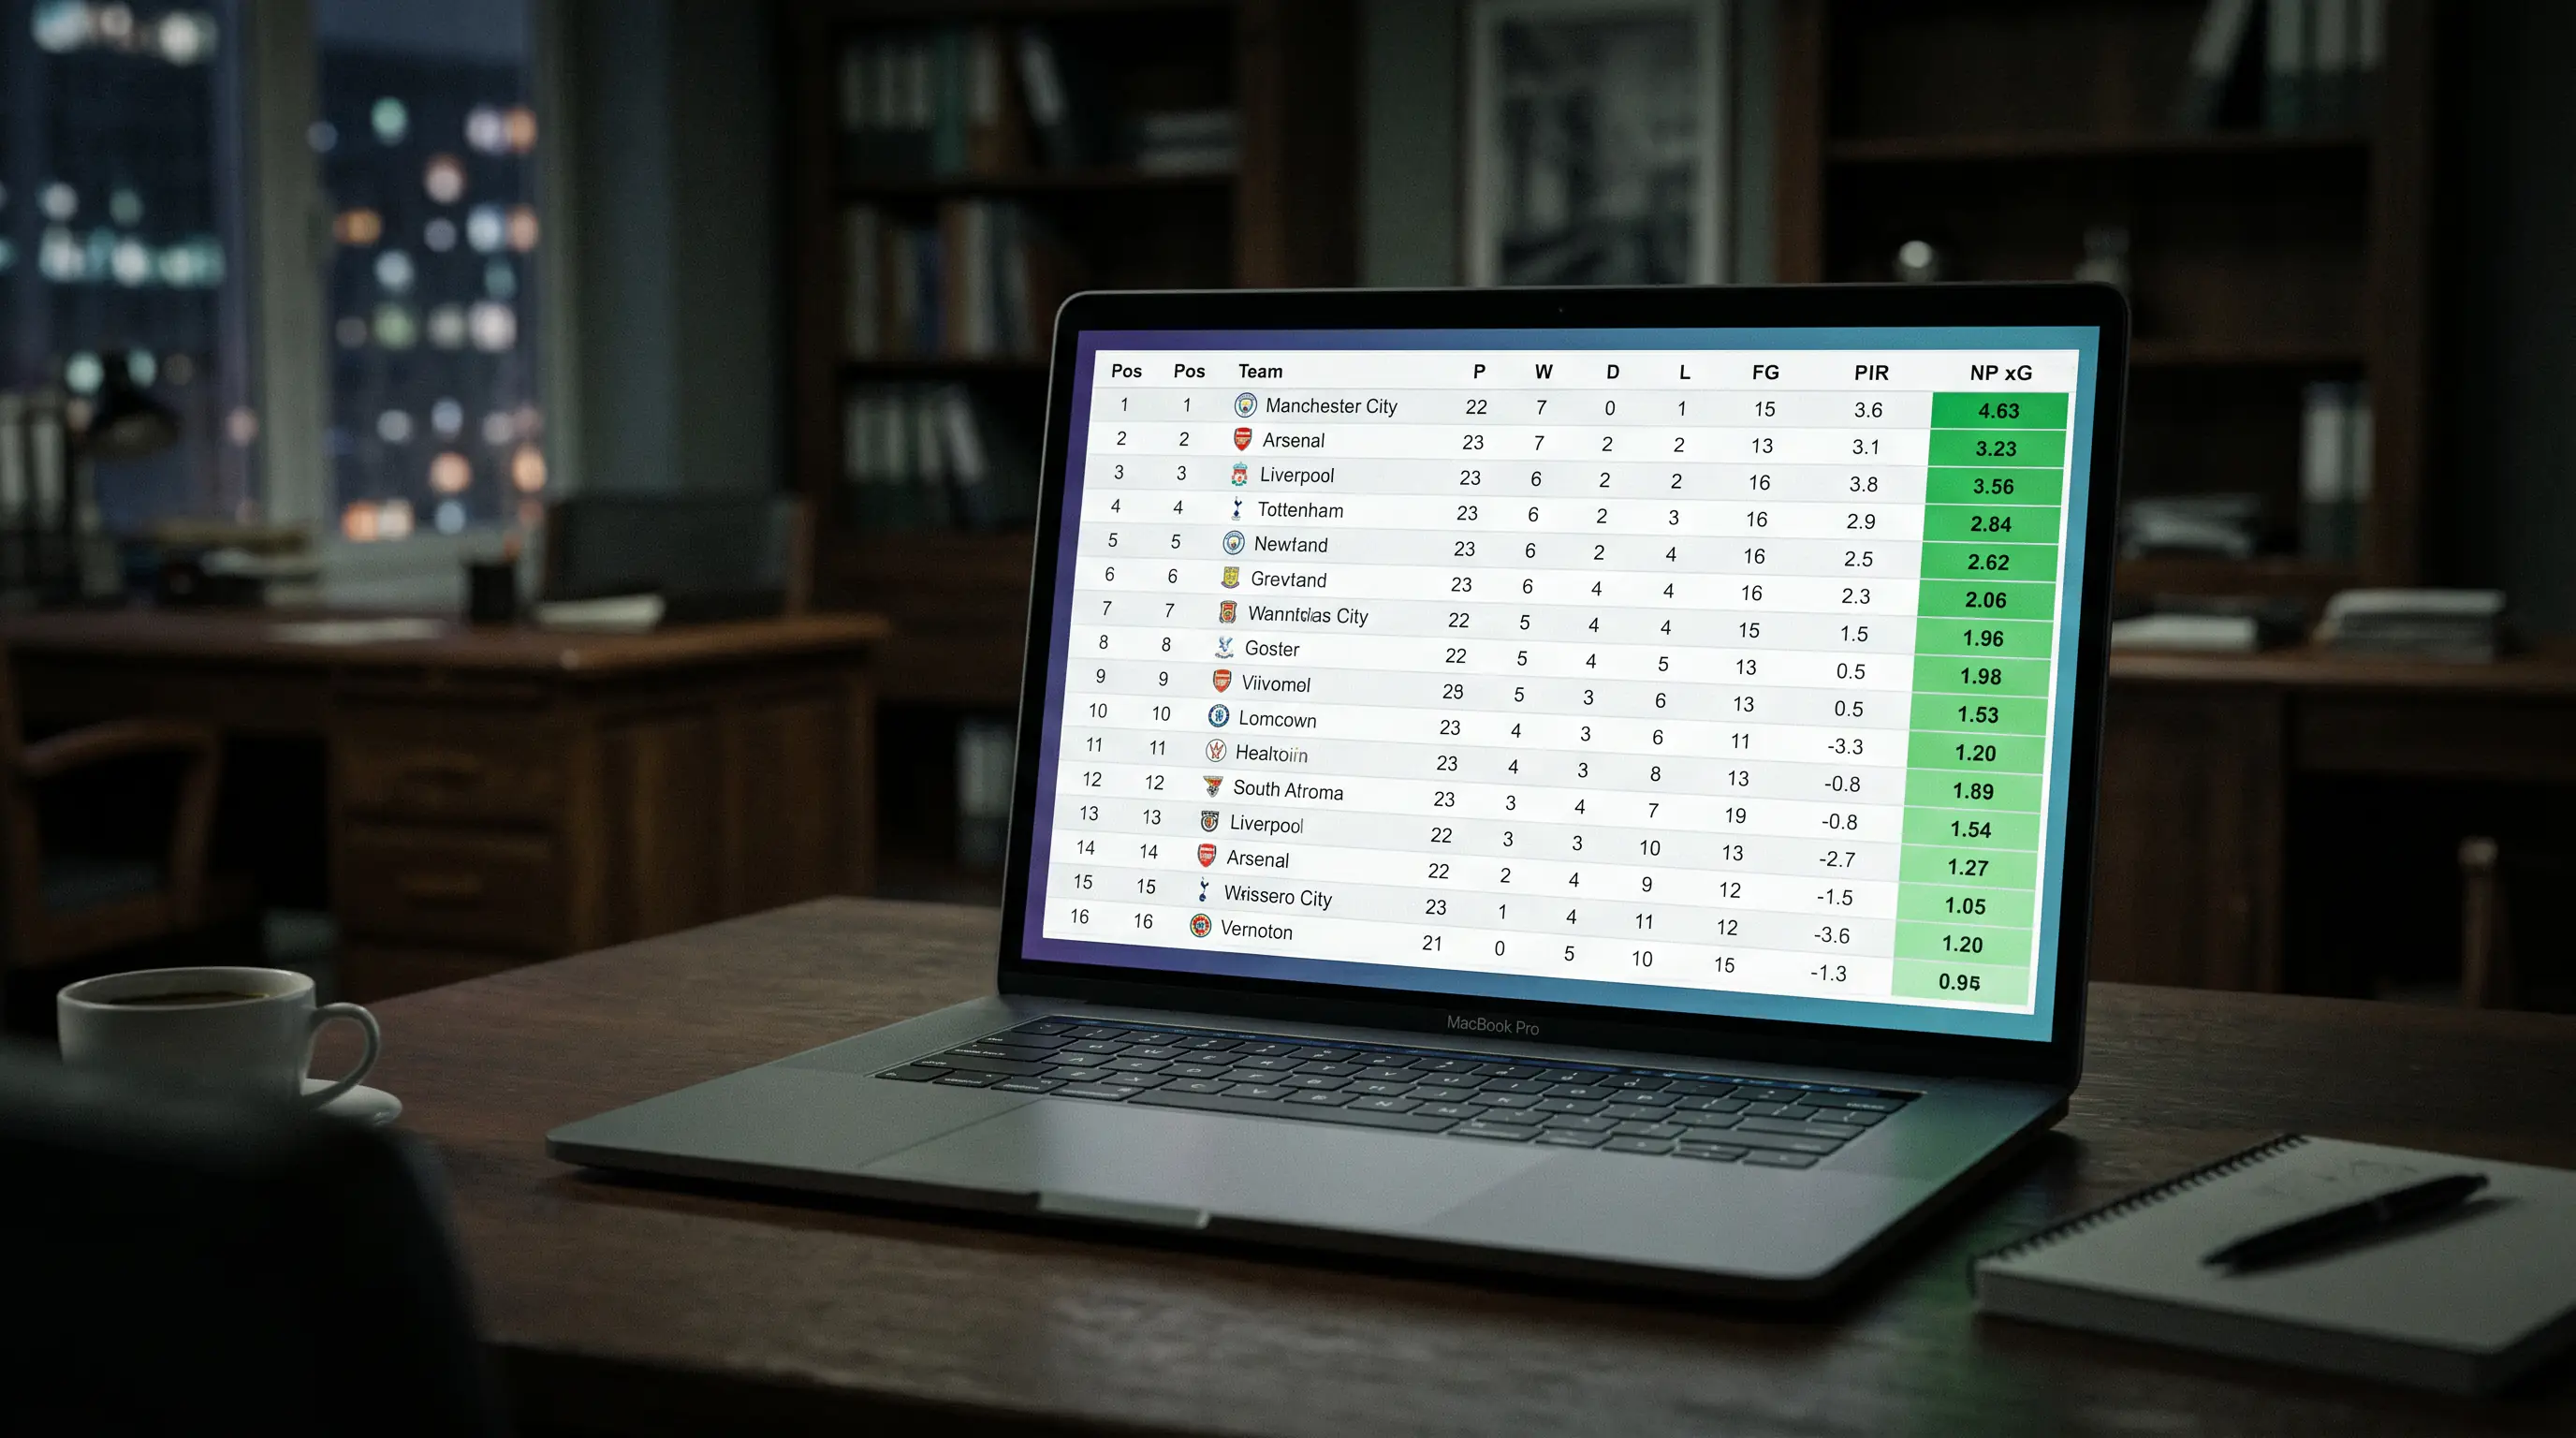
Free Data Sources: FBref, Understat, and Football-Data.co.uk
The quality of freely available football data in 2026 is remarkable. You do not need a paid subscription to build a functional betting model.
FBref provides the deepest free dataset for top European leagues. Match-level xG, xGA, progressive passes, shot-creating actions, defensive pressure stats, and goalkeeper performance metrics are all available at the team and player level. The data comes from StatsBomb via a partnership that makes professional-grade analytics accessible to anyone. I use FBref as my primary source for pre-match analysis.

Understat focuses specifically on xG modelling and provides interactive visualisations of shot maps, xG timelines, and team performance charts. Its xG model differs slightly from StatsBomb’s, which is useful — comparing the two gives you a sense of model uncertainty. If both models agree that a team is underperforming their xG, the signal is stronger than if only one does.
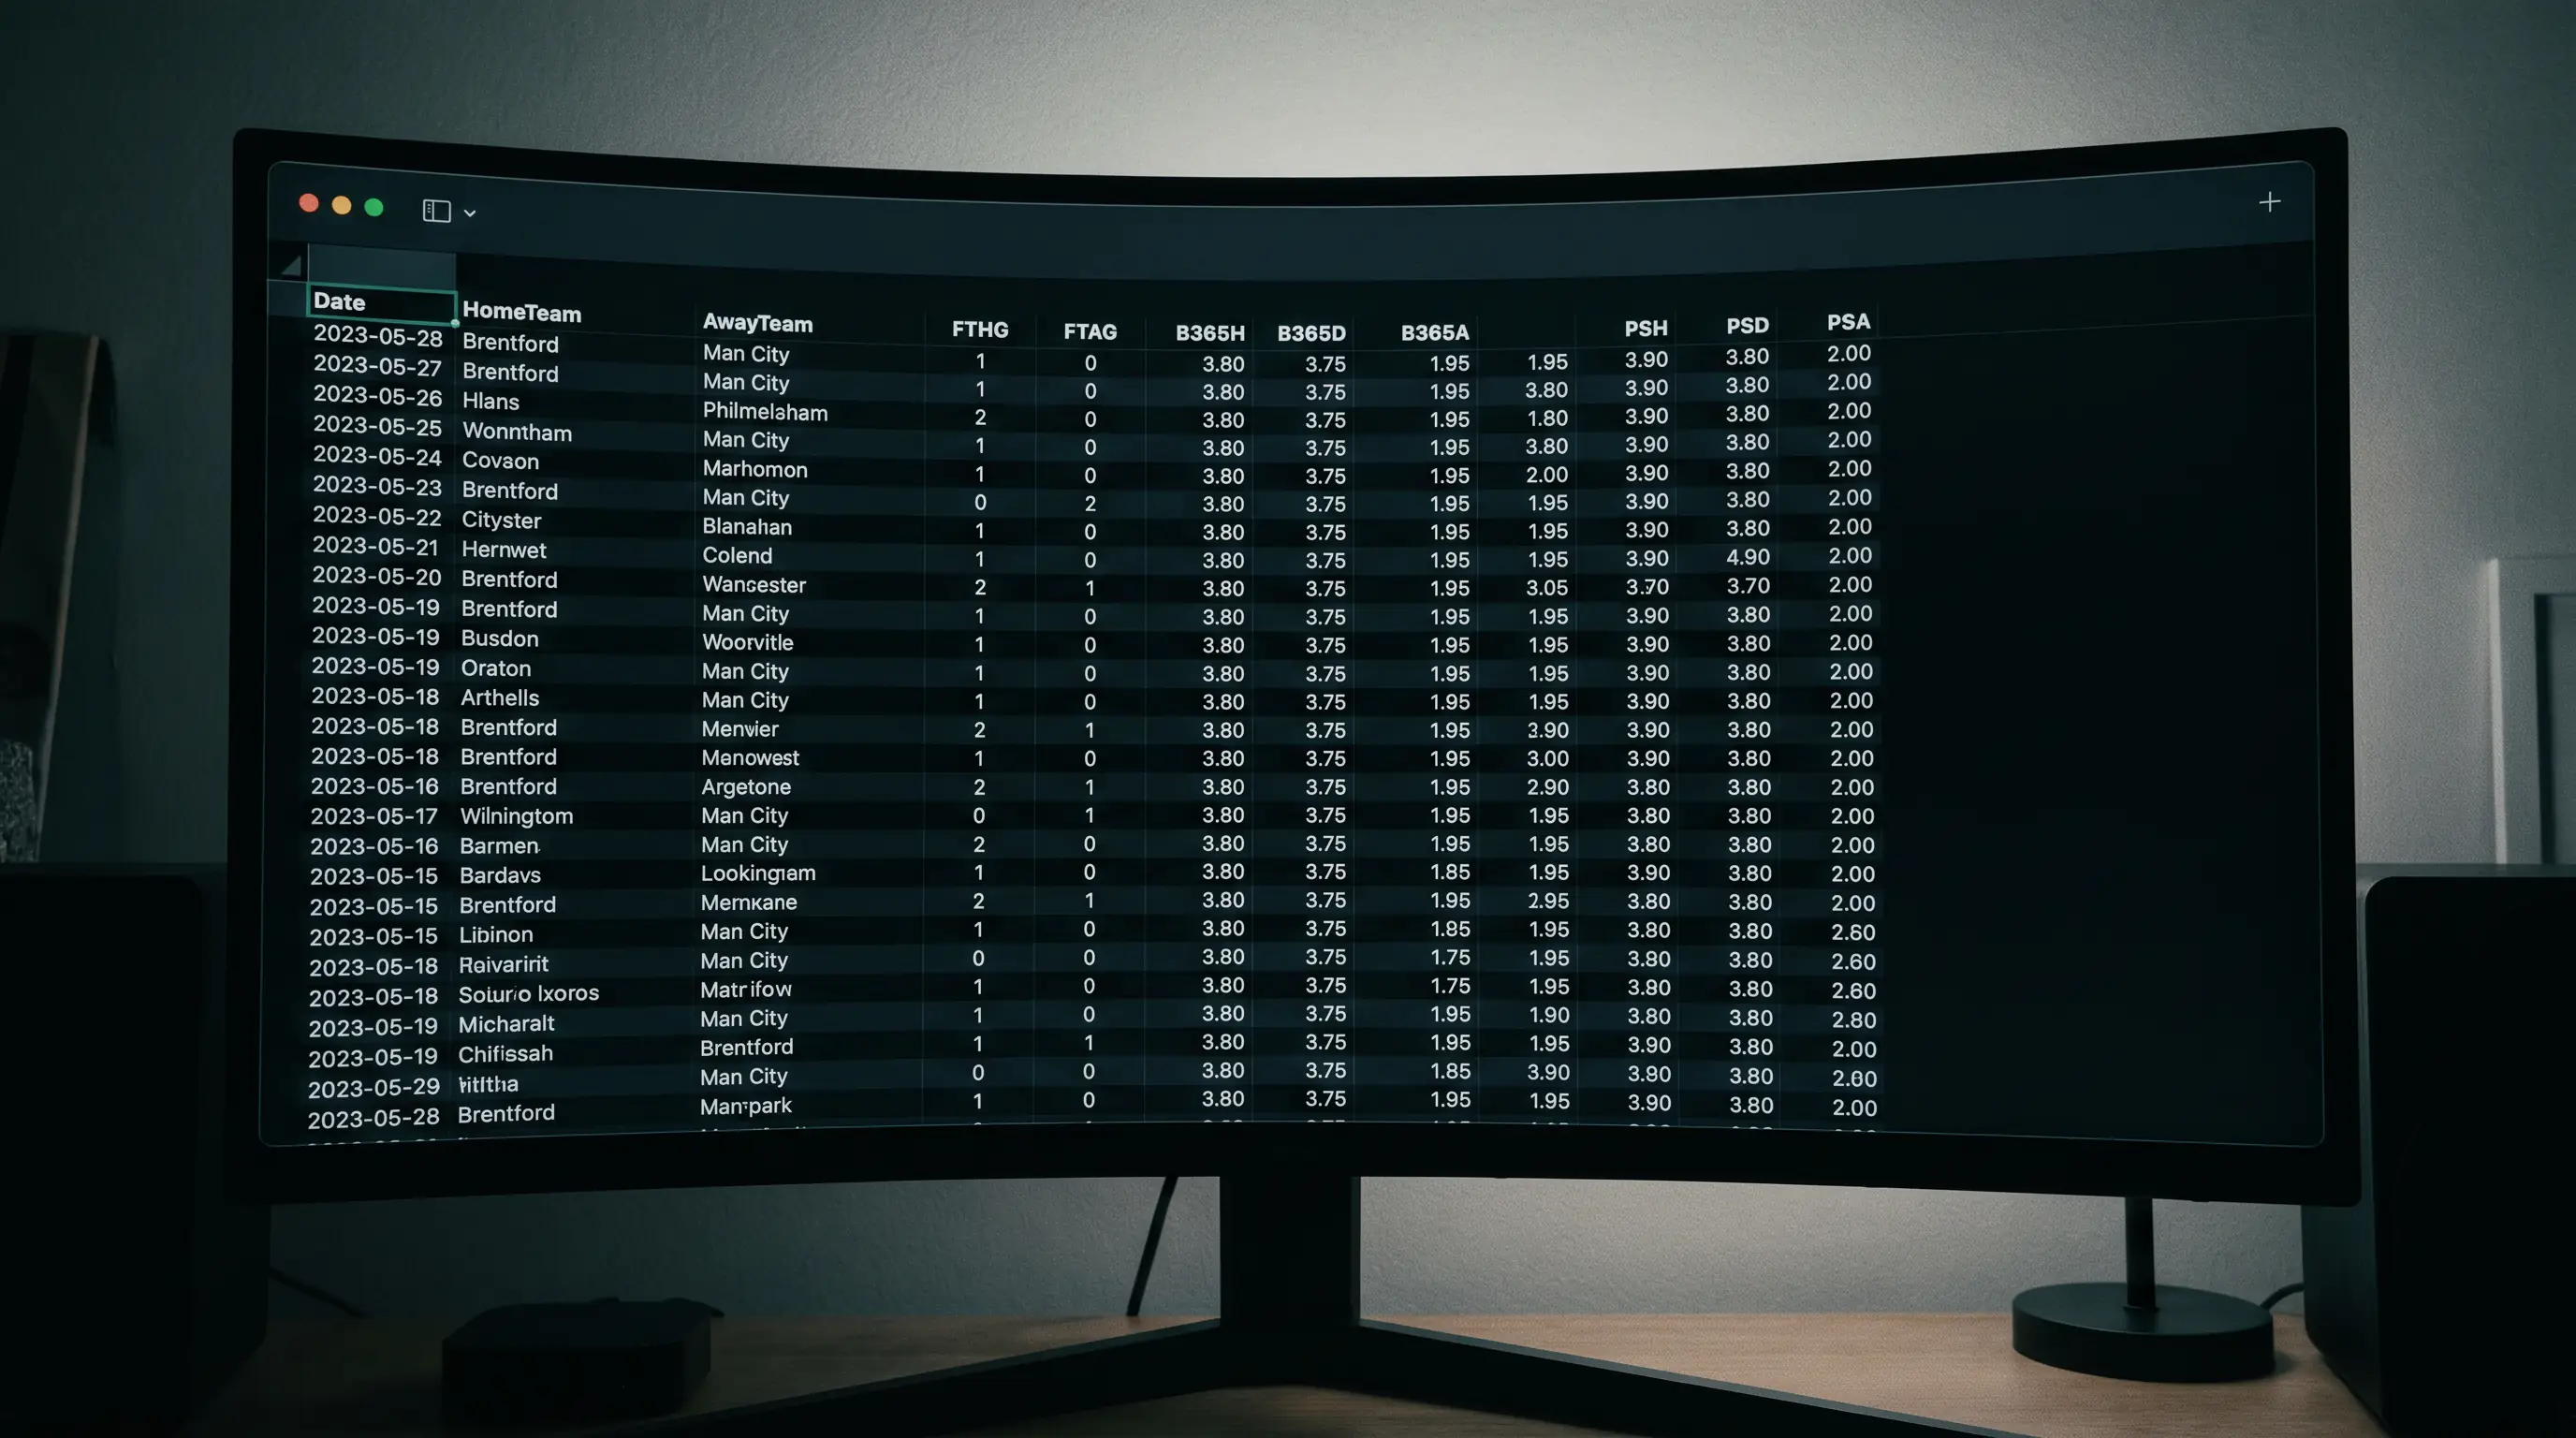
Football-Data.co.uk is the essential resource for historical results and odds data. It provides downloadable CSV files with match results, half-time scores, shots, corners, cards, and closing odds from multiple bookmakers going back over 20 years across dozens of leagues. If you want to backtest a betting strategy — “what would have happened if I had backed every home underdog at odds above 3.00 in the Championship since 2015?” — Football-Data.co.uk provides the raw material.
WhoScored and SofaScore offer match ratings, pass maps, and event-level data that complement the xG-focused sources. I use them less for model inputs and more for qualitative context — understanding why a team’s xG spiked in a particular match, or whether a high-pressing approach is being sustained across fixtures.
Paid Platforms and When They Are Worth It
Paid data platforms become worthwhile when you are betting at a level where the marginal improvement in data quality produces returns that exceed the subscription cost. For most recreational bettors placing 5-10 bets per week at 5-10 pound stakes, free data is more than sufficient.
The paid platforms I have used fall into two categories. The first is data providers — services that offer granular, proprietary datasets with API access for building custom models. These are expensive (hundreds of pounds per year) and only justify the cost if you are building automated or semi-automated betting systems. The second category is analytical tools — services that package existing data into user-friendly dashboards with pre-built metrics, league tables, and alerts. These are more affordable (20-50 pounds per month) and can save significant time if your analysis process is labour-intensive.

My honest assessment is that 90% of the edge available to an individual football bettor can be captured with free data. The remaining 10% requires either proprietary data that no public platform offers or processing speed that exceeds what a manual approach can achieve. If you are not already profitable with free data, paying for premium data will not fix the problem. For a practical guide to turning raw data into value bets, the value betting guide walks through the process of converting probability estimates into actionable selections.
Is xG a reliable stat for football betting decisions?
xG is the best single predictor of future results in football. It separates the quality of chances created from the randomness of finishing, giving a clearer picture of underlying performance than results alone. However, xG is not infallible — it does not account for shot quality within the same location, individual finishing ability, or tactical context beyond the immediate sequence of play. It is most reliable as a medium-term indicator (six or more matches) rather than a single-match signal.
What free football data sources do professional bettors use?
FBref (powered by StatsBomb) for match-level xG and advanced metrics, Understat for xG modelling and shot maps, and Football-Data.co.uk for historical results and closing odds data. These three sources provide the foundation for most independent football betting models. Professional syndicates typically supplement these with proprietary data feeds, but individual bettors can build competitive analysis using only free resources.
