
 Available in US
Content
Both Teams to Score Is One of the UK’s Most Popular Markets — but Is It a Good Bet?
I have a confession. When I first started betting seriously, BTTS was my comfort blanket. Pick a fixture that looks open, back both teams to score at evens or just above, and feel clever when two goals hit the net by half-time. It took me about eighteen months and a detailed spreadsheet review to realise my BTTS record was quietly bleeding money despite a strike rate that felt respectable.
The both-teams-to-score market is one of the most heavily traded in UK football. Around 5.8% of the British adult population bets on football — the highest participation rate among all sports — and BTTS is second only to match result in terms of volume. It is easy to understand, easy to root for, and feels less risky than picking a winner. That perceived simplicity is part of the problem. The market is priced aggressively because operators know casual bettors flood it, and the margins reflect that demand.

Football betting generates roughly 1.3 billion pounds in annual gross gambling yield in the UK. A non-trivial portion of that comes from bettors placing BTTS wagers without ever checking whether the price they are getting reflects the actual probability of both sides scoring. This guide is about fixing that — approaching the market with the same discipline you would bring to any other bet.
How Bookmakers Price BTTS Markets
Pricing BTTS is more complex than pricing a match result, and that complexity is where the operator’s advantage hides. For a 1X2 market, the bookmaker needs to estimate three probabilities (home win, draw, away win). For BTTS, they need to estimate the probability that each team scores at least one goal, accounting for the interaction between offensive and defensive quality on both sides.
The standard modelling approach uses a bivariate Poisson framework — essentially predicting the number of goals each side will score based on their attacking and defensive strength, then calculating the probability that both counts are one or higher. The models ingest data on expected goals, shots on target, defensive blocks, and keeper save rates. When those models are well-calibrated, the resulting BTTS prices are sharp and difficult to beat.

Where the pricing gets softer is in matches with unusual circumstances that the models handle poorly. A newly promoted side with a completely rebuilt defence, a team adjusting to a radical tactical shift mid-season, a goalkeeper injury forcing an untested backup into the starting eleven — these are the situations where the model’s historical inputs lag behind reality. I have found the best BTTS value in the first four to six weeks of a season, when squad turnover has not yet been fully absorbed into the pricing data.
The Stats That Actually Predict BTTS Outcomes
If you ask most football bettors what stats they check before placing a BTTS bet, you will hear “form” and “goals scored”. Those are starting points, not answers. The stats that genuinely predict whether both teams score in a given fixture are more specific — and some of them are counter-intuitive.
Expected goals conceded is the most important metric. A team’s actual goals conceded is noisy — it includes deflections, penalties, own goals, and moments of individual brilliance that are not repeatable. Expected goals conceded strips away the noise and tells you how many goals a team should be conceding based on the quality and volume of chances they allow. A side conceding 1.6 xG per match but only 0.9 actual goals is due for regression. Back BTTS Yes in their fixtures and the market will reward you once reality catches up.
Shot volume in the box matters more than total shots. Teams that generate a high number of shots from outside the area inflate their attacking statistics without proportionally increasing their scoring probability. A side averaging 14 shots per match sounds prolific, but if 10 of those are from 25 yards, their actual goal threat is modest. I filter for shots inside the 18-yard box and weight my analysis accordingly.
Clean sheet rate versus expected clean sheet rate is the BTTS bettor’s secret weapon. Some teams record clean sheets despite allowing high-quality chances — they have been lucky, not solid. Others fail to keep clean sheets despite restricting opponents to very few good opportunities — they have been unlucky. Betting against the lucky sides and for the unlucky ones is a repeatable edge.
Pressing intensity tells you about match tempo. High-pressing teams create turnovers in dangerous areas, which produces chances for both sides. Fixtures between two high-pressing sides — measured by passes per defensive action (PPDA) — tend to produce BTTS Yes outcomes at rates 8-12% above league average in my data.

BTTS Rates Across the Premier League and EFL
I track BTTS hit rates across every division in the English football pyramid, and the variation is striking. Grainne Hurst, CEO of the Betting and Gaming Council, has noted that betting is a genuinely enjoyable experience for 22 million people every month in the UK — and a lot of those people gravitate towards goals markets without understanding how dramatically BTTS rates differ by league.
In recent Premier League seasons, BTTS Yes has landed in roughly 52-55% of matches. The Championship tends to run slightly higher — 54-58% — because the defensive quality is less consistent and the gap between top and bottom is narrower. League One and League Two are where things get interesting. BTTS rates can fluctuate wildly from season to season depending on a few prolific or porous teams, and the bookmaker pricing is less responsive to those swings.
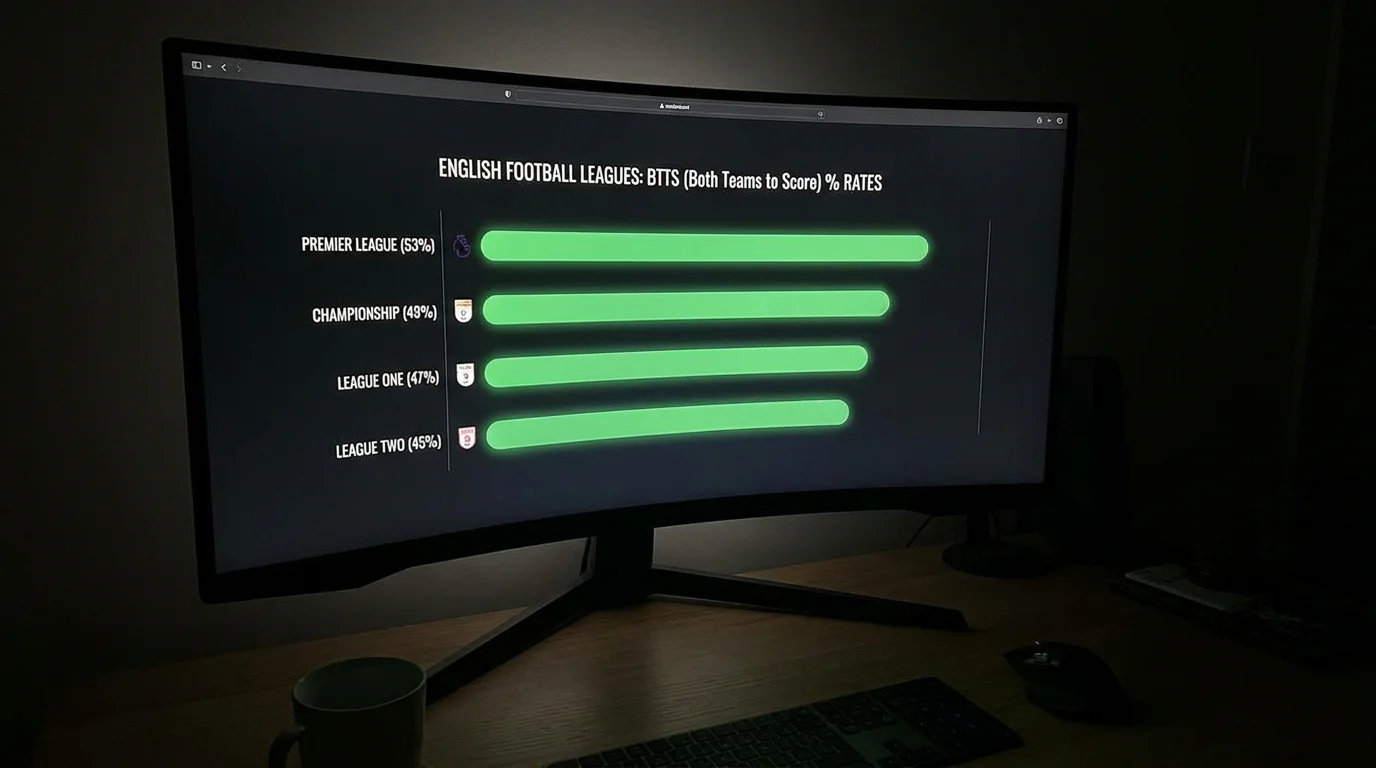
The Scottish Premiership has historically produced BTTS Yes rates above 55%, partly driven by the Old Firm fixtures and the attacking imbalance between the top two and the rest. European leagues vary even more: the Eredivisie regularly pushes above 60%, while Serie A traditionally sits closer to 48-50%. If you are betting BTTS across multiple competitions, understanding these baseline rates is essential — a BTTS Yes price of 1.85 offers very different value in a league that hits 55% compared to one that hits 48%.
I have found the sharpest value in early-season EFL fixtures and in matches where a newly promoted side faces an established mid-table team. The promoted side often carries attacking threat that the market underestimates, while the mid-table side lacks the defensive discipline of the top-six contenders.

BTTS and Over 2.5: When the Double Makes Sense
Combining BTTS Yes with over 2.5 goals is one of the most popular doubles in UK football betting. It sounds like it should be a strong combination — both outcomes are about goals, so they must reinforce each other. The reality is more nuanced.
BTTS Yes and over 2.5 goals overlap heavily but are not identical. A match finishing 1-1 is BTTS Yes but under 2.5 goals. A match finishing 3-0 is over 2.5 goals but BTTS No. The correlation is positive — around 0.65 to 0.70 in most leagues — but not perfect, which means there is a meaningful set of outcomes where one leg wins and the other loses.
The bookmaker knows this correlation and prices the double accordingly. In most cases, the combined price for BTTS Yes and over 2.5 is set tighter than you would get from a naive multiplication. To make this bet profitable, you need to identify fixtures where both outcomes are underpriced simultaneously — not just one. A match where BTTS Yes is value at 1.85 but over 2.5 is fairly priced at 1.70 does not become a value double just because both legs are about goals.
I use the double selectively, primarily in fixtures where my model gives a combined probability above 50% and the bookmaker prices the double at 2.10 or above. That leaves a margin of safety. If you are exploring other over/under goals betting approaches, the goals market guide breaks down the full range of lines from 0.5 to 3.5.

What stats should I check before placing a BTTS bet?
Focus on expected goals conceded rather than actual goals conceded, shots inside the box rather than total shots, and clean sheet rate versus expected clean sheet rate. Pressing intensity measured by PPDA is a useful secondary indicator — high-pressing matchups produce BTTS Yes outcomes at rates well above league average.
Is BTTS Yes or BTTS No the better long-term bet?
Neither is inherently better — it depends on the price and the fixture. BTTS No is often underbet by casual punters who prefer backing goals, which can create value on the No side in fixtures involving defensively disciplined teams. The key is comparing the bookmaker’s implied probability against your own estimate, regardless of which side you take.
Which football leagues have the highest BTTS hit rate?
The Dutch Eredivisie consistently leads major European leagues with BTTS Yes rates above 60%. In England, the Championship typically runs 54-58%, slightly ahead of the Premier League at 52-55%. The Scottish Premiership also produces high BTTS rates, often above 55%. League-level baselines matter because a given BTTS price represents very different value across competitions.
